
Custom Restaurant Data Analytics Solutions
We assisted a large restaurant group in gathering data from their numerous cloud systems and automatically populating the AWS Redshift Data Warehouse. After reorganizing and analyzing this data, we developed Power BI reports and visual dashboards for restaurant managers worldwide. Security measures and user permissions were customized for various management groups, ranging from the executive suite to middle management.
MOST Programming took the lead in the Data Analytics Project for a global restaurant organization.
Weaving Data from Different Threads into a Single Clear Story
With many restaurants throughout the country and internationally, the client had very large and complex data sets. These were from multiple sources. The requested output data ranged from details such as food quantities sold per hour per restaurant, to daily restaurant profitability, to corporate metrics.
Combining this data into meta data sets and then meaningful, individualized reports for these diverse groups with very different needs was a significant challenge.
THE CHALLENGE
Empowered Decisions with Data Visualization
The development architecture was created and then refined. The client was consulted on future data sets and development requirements to ensure the architecture would accommodate long term goals. Our development and analyst team created APIs and a data warehouse for the many data sets.
Our Power BI team of specialists worked closely with the client to develop the best visualization profiles that would aid the wide group of users. The users ranged from the CEO, CFO, COO and the rest of the Executive team, Finance and Accounting, Regional Operation Managers, to the individual restaurant Managers and Operating Staff. Using Power BI, and very large data sets from many disparate data sources, the team created individualized reports with specialized filters and designated access groups.
THE SOLUTION
Achieved Data-Driven Efficiency
Instead of looking through a multitude of disjointed excel files, everyone had access to their own specialized information in a visualized, easy to understand format. They could dig down to the finest detail when necessary. Comparisons with prior months, quarters, years, other stores, and many other scenarios were readily available.
The result: The teams were able to manage their operations in a much more efficient and profitable way.
THE RESULT


Restaurant Data Analytics: Complete Guide to Data-Driven Restaurant Success
Introduction
Restaurant data analytics is the systematic process of collecting, integrating, and analyzing operational data from across your restaurant to generate actionable insights that drive profitability and growth. This discipline transforms raw sales data, customer data, and operational metrics into strategic decisions that separate thriving establishments from those merely surviving.
This guide covers the complete landscape of data analytics for the restaurant industry, from understanding core concepts and data sources to practical implementation and overcoming common obstacles. Restaurant owners, operations managers, and restaurant operators at any stage of their analytics journey will find relevant frameworks here. What falls outside our scope: specific software tutorials, coding instructions, or enterprise-level data warehousing architectures.
Direct answer: Restaurant data analytics transforms scattered operational information into data driven insights that improve profitability by 10-20% through optimized menu pricing, reduced food waste, and enhanced customer experiences.
By the end of this guide, you will understand:
- How to unify all the data from disparate systems into a coherent analytics strategy
- Which key performance indicators matter most for your restaurant business
- Practical methods to identify opportunities for cost reduction and revenue growth
- Implementation steps that avoid common pitfalls and accelerate ROI
- How predictive analytics shapes the future of competitive restaurant operations
Understanding Restaurant Data Analytics
Restaurant analytics encompasses the tools, techniques, and processes that extract insights from operational data to inform decision-making across every aspect of your business. Unlike gut-instinct management, this approach grounds strategic decisions in measurable patterns from your POS system, inventory management software, customer feedback platforms, and labor scheduling tools.
The distinction from basic restaurant reporting matters: traditional reports tell you what happened yesterday, while advanced analytics reveal why it happened and what will likely happen tomorrow.
Types of Restaurant Data
Sales and Transaction Data
Your point of sale system captures the richest data in your operation. Every transaction records menu items sold, pricing, discounts applied, payment methods, timestamps, order types (dine-in, takeaway, food delivery), and tip amounts. This granular sales data reveals peak hours, top selling items, average check sizes, and channel-specific performance. Understanding which items generate most revenue during specific time periods directly informs menu engineering.
Customer Behavior and Preference Data
Customer data flows from loyalty programs, reservation systems, mobile apps, and online ordering platforms. This information tracks visit frequency, order histories, spending patterns, and customer preferences. Restaurants leveraging this data effectively identify their highest average transaction values segments and tailor promotional offers accordingly.
Operational Data
Inventory data, labor costs, and kitchen efficiency metrics form your operational backbone. Food costs as a percentage of sales, inventory turnover rates, waste percentage, and sales per labor hour reveal whether your operation runs profitably. Tracking these data points against historical sales trends exposes inefficiencies invisible to casual observation.
External Data
Weather patterns, local events, competitor activity, and seasonal trends influence demand in ways internal data alone cannot predict. Sophisticated restaurant operators integrate external data gathering sensors and market intelligence to refine forecasting accuracy.
Data Sources in Restaurants
Point of Sale Systems and Payment Processing
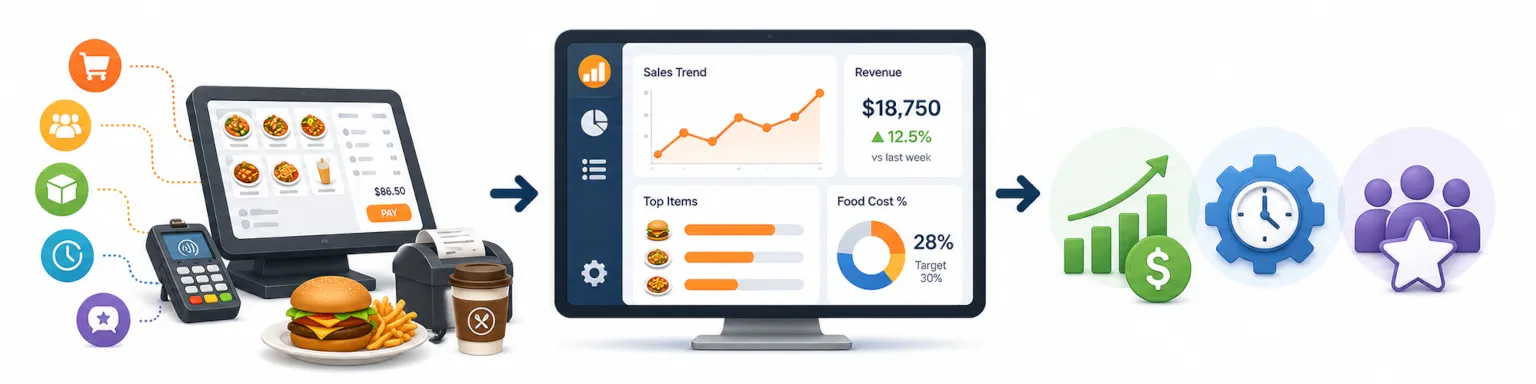
Your POS system serves as the primary analytics hub, capturing transactional detail that flows into every other analysis. Modern systems integrate with payment processors to provide real time data on sales trends, discount usage, and revenue by channel. Table side tablets and mobile devices extend this capture to include ordering behavior and engagement patterns.
Inventory management platforms track ingredient usage, waste, spoilage, and variance between theoretical and actual consumption. When integrated with recipe costing, this data calculates true food costs per dish and identifies where waste reduction efforts should focus.
Customer Feedback Platforms
Review aggregators, in-app surveys, and comment cards generate customer feedback that quantifies customer satisfaction and reveals service gaps. Sentiment analysis across these multiple sources highlights recurring issues that impact the dining experience.
Staff Scheduling and Labor Management
Labor platforms track hours worked, overtime trends, scheduling efficiency, and staff performance metrics. Cross-referencing this with sales data produces sales per labor hour—a critical profitability indicator that guides optimal shift planning.
Analytics vs. Traditional Reporting
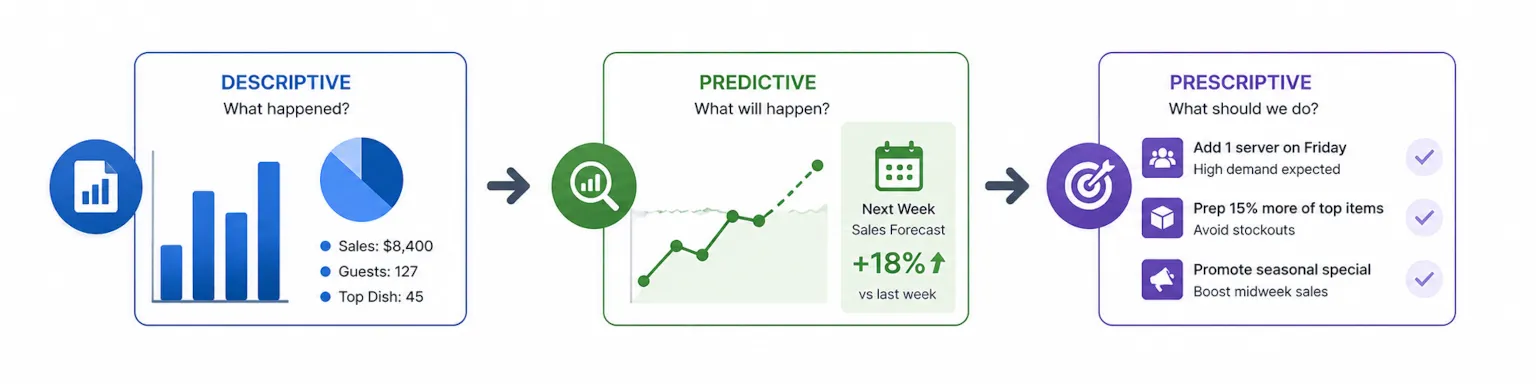
Traditional restaurant reporting delivers descriptive snapshots: yesterday’s sales totaled $8,400, you served 127 guests, your top dish sold 45 units. These facts matter but answer only “what happened.”
Restaurant data analytics adds diagnostic, predictive, and prescriptive layers. Diagnostic analytics explains why Saturday’s revenue dropped 15%—perhaps a stockout of your best appetizer coincided with a competing event downtown. Predictive analytics forecasts next week’s traffic flow based on historical patterns and upcoming local events. Prescriptive analytics recommends specific actions: “Reduce Tuesday prep labor by two hours based on predicted 22% lower traffic.”
This progression from scorekeeping to strategic guidance represents the fundamental shift that data driven decisions enable.
Key Applications of Restaurant Data Analytics
The foundational concepts above become valuable only through practical application. The following areas represent where restaurant analytics delivers measurable returns most consistently.
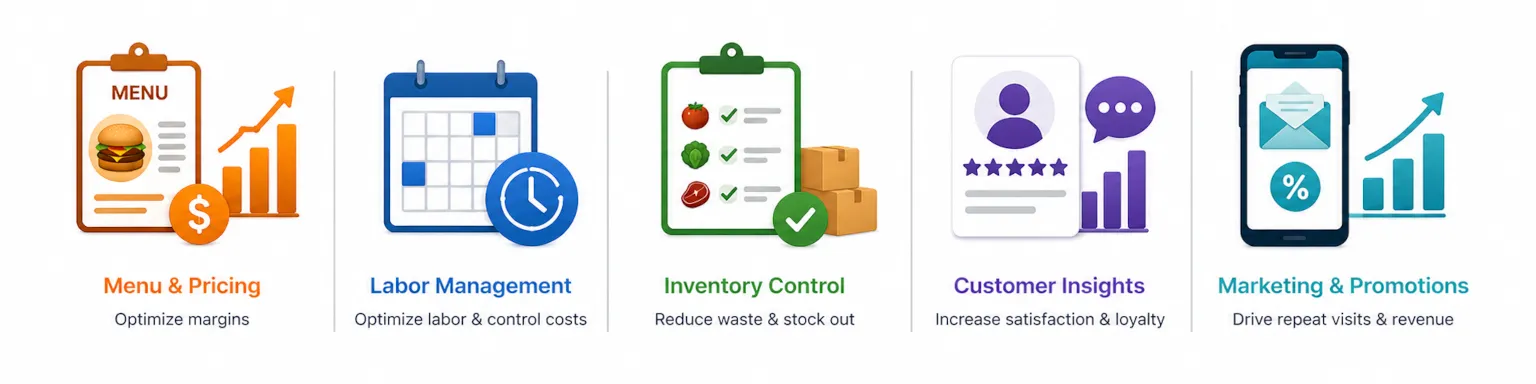
Menu Optimization and Pricing
Item Profitability Analysis and Menu Engineering
Not all popular dishes are profitable. Menu insights emerge from combining sales velocity with contribution margin—the difference between price and food costs. A bestseller generating $2 profit per unit may contribute less than a moderate seller at $8 margin. Analytics identifies which menu items deserve promotional emphasis and which quietly drain profit margins.
Demand Forecasting for Seasonal Planning
Historical sales trends reveal how specific items perform across seasonal trends, holidays, and weather conditions. This forecasting prevents over-preparation of slow movers while ensuring adequate inventory for predictable surges. Restaurants using demand analytics reduce food waste by 10-20% through precision purchasing.
Price Elasticity Analysis
Testing price adjustments on specific items and measuring demand response reveals customer price sensitivity. Some dishes tolerate increases with minimal volume impact; others prove highly elastic. Analytics removes guesswork from pricing strategy, helping increase sales while protecting margins.
Operations and Inventory Management
Staff Scheduling Optimization
Analyzing guest count patterns by hour and day allows precise labor deployment. Rather than overstaffing slow Tuesday lunches or understaffing Friday dinner rushes, data-aligned scheduling maximizes sales per labor hour while maintaining service quality. This directly reduces labor costs without sacrificing customer experiences.
Inventory Turnover and Waste Reduction
Inventory data analyzed against sales consumption reveals items sitting too long or moving faster than reorder cycles accommodate. Waste tracking—capturing what’s discarded through spoilage, errors, or over-portioning—typically reveals 4-10% of food purchased never reaches customers. Identifying and addressing these leaks protects margins more reliably than revenue growth alone.
Kitchen Efficiency Analytics
Order fulfillment times, ticket completion rates, and kitchen throughput metrics expose bottlenecks in delivery operations. Whether your constraint is prep capacity, cooking equipment, or expediting, operational analytics pinpoints exactly where efficiency gains are possible.
Customer Experience and Marketing
Customer Segmentation and Personalization
Combining customer data from loyalty programs, reservation systems, and order history creates distinct segments: frequent weekday lunchers, occasional celebration diners, delivery-only customers. Each segment responds to different marketing efforts and menu emphasis. Personalized outreach based on this segmentation boosts retention and average check by 15-25% versus generic communications.
Loyalty Program Optimization
Analytics reveals which loyalty incentives drive incremental visits versus simply discounting purchases that would occur anyway. Understanding earn and burn patterns, redemption rates, and program member lifetime value enables restructuring rewards to improve customer service metrics and profitability simultaneously.
Campaign Effectiveness and ROI Tracking
Digital marketing enables precise tracking of return on ad spend across channels. Analytics connects promotional offers to resulting transactions, revealing which campaigns attract new customers profitably and which waste budget. This data driven approach to marketing efforts ensures spend correlates with measurable outcomes.
Implementing Restaurant Data Analytics
Moving from concept to execution requires structured implementation. The following framework guides restaurants from initial assessment through sustained optimization.
Step-by-Step Implementation Process
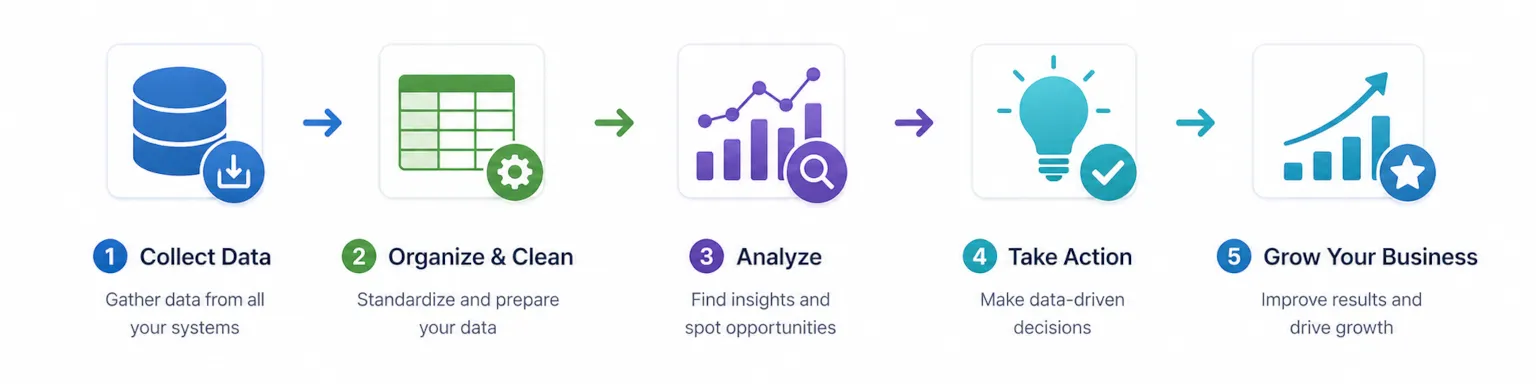
Before selecting tools, audit your current state—what data exists, where it lives, and what gaps prevent unified analysis.
- Assess current data infrastructure and identify gaps. Catalog every system touching data: POS, inventory, scheduling, reservations, delivery platforms, loyalty programs. Document what each captures, export capabilities, and integration options. Identify silos preventing you from seeing all that data in one view.
- Choose analytics platform and integrate with existing systems. Select a platform matching your scale and technical capacity. Prioritize solutions that connect your primary systems without custom development. Cloud-based options from major POS providers often offer the fastest path to value.
- Define key performance indicators and business goals. Limit initial focus to 8-10 KPIs aligned with specific objectives. Cover four pillars: sales and revenue (total sales, sales by daypart, sales by channel), costs (food cost percentage, labor cost percentage, prime cost), guests (retention rate, visit frequency, average check), and operations (wait times, table turnover, scheduling efficiency).
- Set up data collection and automated reporting. Configure dashboards that surface priority metrics without manual data gathering. Automate daily, weekly, and monthly report distribution to relevant stakeholders. Eliminate the friction that prevents consistent data review.
- Train staff on data interpretation and action planning. Analytics provide restaurants with valuable insights only when staff can interpret and act on them. Invest in training managers to read dashboards, spot anomalies, and translate findings into operational adjustments. A data analyst mindset should permeate management decisions.
- Monitor performance and continuously optimize processes. Analytics implementation is iterative. Track whether metrics improve, refine KPI definitions, expand data sources, and deepen analysis sophistication over time. Monthly reviews ensure the system evolves with your operation.
Common Challenges and Solutions
Implementation rarely proceeds without obstacles. The following challenges appear consistently across the restaurant space, alongside proven solutions.
Data Integration and Quality Issues
Disparate systems that don’t communicate create fragmented views where you cannot gain insight across your full operation. Solution: Conduct a thorough audit of integration capabilities before selecting platforms. Prioritize solutions with native connectors to your existing systems. Where gaps exist, middleware tools like Zapier or dedicated restaurant integration platforms bridge connections. Establish data validation processes to catch quality issues before they corrupt analysis.
Staff Adoption and Training Barriers
Digital tools provide invaluable insights only when staff actually use them. Resistance often stems from fear of surveillance or simply added complexity. Solution: Frame analytics as tools that help staff succeed, not surveillance mechanisms. Start with simple, high-impact metrics before introducing complexity. Celebrate wins publicly when data driven insights lead to improvements. Make dashboard access easy—displays in person at manager stations or mobile devices reduce friction.
Budget Constraints and ROI Concerns
Smaller operators question whether analytics investments justify their cost. Solution: Begin with capabilities already included in existing systems—most modern POS platforms include basic analytics at no additional charge. Track specific improvements attributable to analytics decisions (reduced waste, optimized scheduling, higher check averages) to build the case for expanded investment. Phased implementation spreads costs while delivering incremental value.
Data Privacy and Security Compliance
Customer data collection creates regulatory obligations under GDPR, CCPA, and industry standards. Solution: Work with platforms that maintain compliance certifications and provide clear data handling documentation. Implement data minimization practices—collect only what you’ll use. Establish retention policies and secure access controls. Regular security audits protect both customers and your reputation.
Conclusion and Next Steps
Restaurant data analytics transforms how operators understand and optimize their businesses. By unifying sales data, customer data, inventory data, and operational metrics into coherent analysis, restaurants replace intuition with evidence—identifying exactly where profit margins leak, which customers deserve extra attention, and how to stay ahead of demand patterns.
The path forward requires action:
- Audit your current data capabilities this week. Document what systems you have, what data they capture, and where integration gaps exist.
- Identify your highest-priority use case. Whether that’s reducing food waste, optimizing labor costs, or improving customer retention, focus initial efforts on one area with clear metrics.
- Research platform options matching your scale and needs. Use the comparison framework above to shortlist solutions worth evaluating.
For operators ready to go deeper, explore related topics: restaurant technology trends shaping the next five years, customer retention strategies that leverage analytics insights, and inventory optimization techniques that protect margins while maintaining quality.
Additional Resources
Key Restaurant Analytics KPIs and Benchmarks
- Prime cost (food + labor): Target under 60-65% of sales
- Food cost percentage: Industry range 28-35%
- Labor cost percentage: Typically 25-35%
- Food waste: Average 4-10% of purchases; top performers under 3%
- Guest retention rate: 20% improvement in retention typically adds 25-95% to profitability
Essential Data Sources to Integrate
- Primary: POS system, inventory management, scheduling platform
- Secondary: Reservation system, loyalty program, online ordering
- Tertiary: Customer feedback platforms, delivery aggregators, social media
Implementation Timeline Expectations
- Basic reporting: 2-4 weeks
- Integrated dashboards: 1-3 months
- Predictive capabilities: 6-12 months with sufficient historical data
The restaurants achieving competitive edge through analytics share one trait: they started. Begin your deep dive into your data today, and the valuable insights will follow.
Final Notes:
See our entire stack of technologies we can work with at MOST programming here.
Interested in AI development services? You can learn more about our AI and machine learning services and experts here.
Need help with Power BI and building your own custom dashboards? We can help at MOST programming. Here's a link to our Power BI development services case study.
Too much data in too many places? Then we can help you aggregate and consolidate that data into usable business insights. Check out our case study here.
Not sure which approach fits your restaurant? A short conversation can help identify the best starting point.
FAQs related to Restaurant data analytics
What is restaurant data analytics?
Restaurant data analytics is the process of collecting, organizing, and analyzing restaurant data such as sales, labor, inventory, menu performance, and guest behavior to improve profitability, operations, and decision-making.
What does restaurant data analytics typically measure?
Restaurant data analytics commonly measures revenue trends, average check size, item-level sales, cost of goods sold, prime cost, labor efficiency, peak-hour performance, table turns, delivery versus dine-in mix, and customer retention indicators.
What types of data sources are used in restaurant data analytics?
Restaurant data analytics typically uses data from POS systems, online ordering platforms, reservations and waitlists, loyalty programs, delivery marketplaces, inventory tools, labor scheduling, accounting systems, and customer feedback channels.
How does restaurant data analytics improve profitability?
Restaurant data analytics improves profitability by identifying high-margin menu items, pricing opportunities, waste and shrink drivers, labor scheduling inefficiencies, discount leakage, and underperforming channels so operators can act on what is actually driving profit.
What are the most important KPIs in restaurant data analytics?
Common restaurant data analytics KPIs include gross sales, net sales, average ticket, items per ticket, prime cost, food cost percentage, labor cost percentage, contribution margin by menu item, revenue by daypart, and repeat customer rate.
Can restaurant data analytics help with menu engineering?
Yes. Restaurant data analytics supports menu engineering by analyzing item popularity and profitability, tracking modifier behavior, identifying attachment opportunities, and showing which items drive repeat purchases versus one-time orders.
How does restaurant data analytics support labor optimization?
Restaurant data analytics supports labor optimization by aligning staffing levels to demand by daypart, comparing labor cost to sales, monitoring overtime and productivity, and improving schedule accuracy based on historical traffic patterns.
What is the difference between reporting and restaurant data analytics?
Reporting summarizes what happened, while restaurant data analytics explains why it happened and what to do next by combining multiple data sources, standardizing definitions, and surfacing drivers, anomalies, and actionable recommendations.
How do restaurants handle multi-location restaurant data analytics?
Multi-location restaurant data analytics standardizes KPIs across stores, normalizes POS and channel data, and enables location comparisons for labor, menu performance, promotions, and operational consistency while preserving local nuances like daypart demand.
Is restaurant data analytics useful for delivery and online ordering?
Yes. Restaurant data analytics is critical for delivery and online ordering because it helps track channel profitability, fees and discounts, menu conversion, fulfillment time impacts, item availability issues, and customer repeat behavior by channel.
What are common challenges solved by restaurant data analytics?
Restaurant data analytics solves challenges such as disconnected data sources, inconsistent KPI definitions, delayed reporting, inaccurate inventory signals, promotion performance uncertainty, labor inefficiency, and limited visibility into item-level profitability.
What is a typical process for implementing restaurant data analytics?
A typical restaurant data analytics process includes discovery of goals and KPIs, source system mapping, data cleaning and standardization, dashboard and report buildout, validation against finance and POS totals, rollout, and ongoing iteration as operations change.