
Driving Better Outcomes with Transportation Data Analytics
MOST Programming works closely with the City and County of Denver to integrate and analyze travel time data and traffic signal data.
Traffic behavior data is modeled across defined intersections and corridors. Visual dashboards reflect real-time traffic behavior. Anomalies are identified in real-time and provided to traffic engineers and the Denver Operations Center.
Managing Traffic Complexity
With over 1500 intersections in the City and County of Denver, and multiple incidents a day at different times, how could the Operations Center determine what was “normal traffic” and what were abnormal anomalies.
Which of the 1500 intersection monitors should be watched and when to help identify traffic disruptions and improve traffic flow and safety?
THE CHALLENGE
Built Custom Data Analytics Modeling Algorithm
The MOST Team designed data analytic modeling algorithms to compute baseline models of expected traffic conditions and flow (Fingerprints). Statistical “normal” data characteristics were defined and calculated over specified time frames, variable from days to weeks to months to a year(s). This was calculated in 10 minute increments. Real-time traffic data characteristics (Snapshots) are then compared to the normalized historical data characteristics and flow (Fingerprints), both historically and in real time.
This comparison identifies statistical “out of norm” situations. Out-of-norm thresholds are used to provide real-time anomaly alerting. Traffic behavior data is modeled across defined intersections and corridors. MOST Programming automates data collections, aggregates historical data, and provides anomaly alerting of real-time traffic signal data.
THE SOLUTION
Provided Traffic Dashboards and Anomaly Alerts
Visual dashboards are developed and designed to reflect traffic behavior.
Anomalies are identified in real-time and provided to traffic engineers and the Denver Operations Center for action. Traffic flow can be analyzed over time and ongoing anomalies identified to take action for improved traffic flow along corridors and at highly congested intersections. Traffic Signal Priorities (TSP) are analyzed to predict the best timing of priority signals with the least disruption of traffic at intersections along bus routes and snow plow routes.
THE RESULT
ANOMALY VISUALIZATION EXAMPLE


Maximizing Efficiency with Transportation Data Analytics Strategies
Introduction to Analytics in Transportation
Who Should Read This and Why It Matters
Transportation data analytics is at the forefront of innovation in the transportation industry, making it essential reading for transportation professionals, data analysts, and decision-makers seeking to optimize operations and stay competitive. Understanding transportation data analytics is crucial for these audiences because it empowers them to make informed, data-driven decisions that enhance efficiency, safety, and customer satisfaction in a rapidly evolving landscape. This guide will also explore real world applications of transportation data analytics, highlighting its practical impact on logistics, traffic management, and overall transportation efficiency.
What Is Transportation Data Analytics?
Transportation data analytics utilizes techniques like predictive modeling, machine learning, and real-time analysis. Machine learning is an increasingly important element of transportation data analytics, enabling the analysis of large datasets to identify patterns, trends, and actionable insights. A solid understanding of data structures is essential for efficiently managing and analyzing transportation data, as it underpins effective data analysis workflows and robust database design. This field supports smarter route optimization, cost reduction, predictive maintenance, and improved resource allocation, making it a vital component of modern transportation systems.
Scope of This Guide
This article covers the following main topics to provide a comprehensive understanding of transportation data analytics:
- Data collection and quality, including common data sources, best practices, and the critical importance of collecting accurate data to ensure reliable and actionable analytics
- The data analysis process, with step-by-step guidance
- Data processing and big data management
- The role of data scientists in transportation analytics
- Applications of analytics in real-world transportation scenarios
- Tools and free software for analysis
- Smart city traffic management and electric vehicle infrastructure
- Overcoming analysis barriers and ensuring reproducible analysis
- A summary highlighting the mission-critical role of transportation data analytics
By exploring these areas, readers will gain practical knowledge to maximize efficiency and drive innovation in transportation operations.
Data Collection and Quality
Data Sources
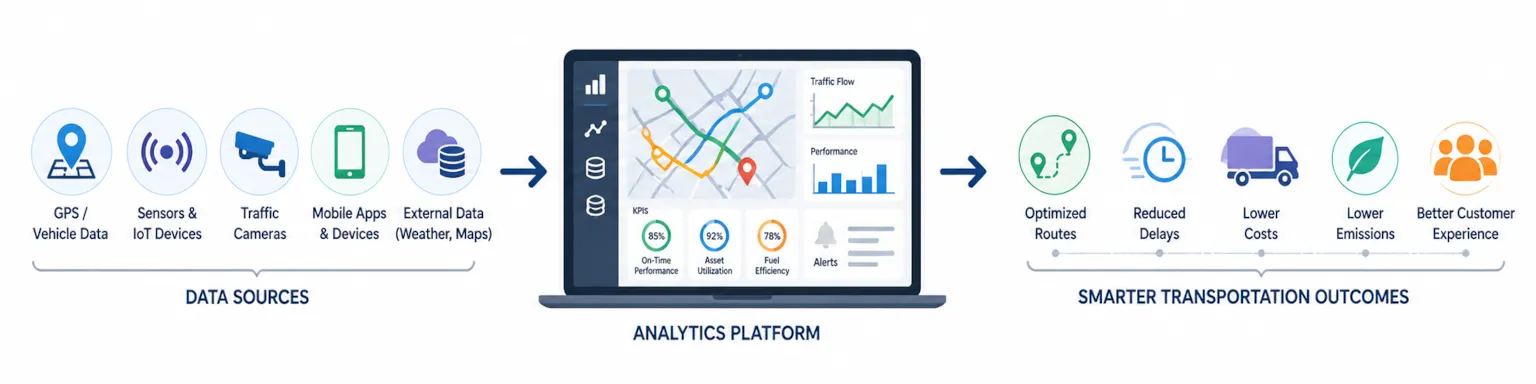
Data collection is a critical step in the data analysis process, involving the gathering of raw data from a variety of sources. Common data sources for transportation analytics include:
- GPS data from vehicles, trucks, and transport units
- Sensor data from vehicles and infrastructure
- Traffic cameras and surveillance systems
- Mobile devices and mobile network data
- Survey data from passengers and operators
- Geospatial sources such as mapping platforms
- Connected Vehicle data, an emerging and valuable source
Collecting a comprehensive data set and ensuring sufficient data are essential for reliable transportation data analytics, as incomplete or limited data can lead to inaccurate conclusions.
Ensuring Data Quality
Data quality is essential for accurate analysis and decision making. This requires careful data cleaning and processing to ensure accuracy and reliability. Individual data points are analyzed to identify outliers and trends in transport data, providing deeper insights into transportation patterns and system performance.
Statistical data analysis and exploratory data analysis are used to examine data quality and identify areas for improvement. Adhering to data privacy regulations and best practices is also necessary when collecting and using transportation data.
Data Visualization
Data visualization is a powerful tool for communicating data insights and trends. It helps identify patterns and relationships in the data, making complex information accessible to stakeholders and supporting better decision-making.
With high-quality data collected and prepared, the next step is to process and analyze this information to extract actionable insights.
Data Analysis Process
The data analysis process is your backbone for effective transportation data analytics, guiding you through a series of iterative phases to extract actionable insights from complex data sets. This systematic approach ensures that each stage builds upon the previous one for maximum impact.
Step-by-Step Data Analysis Process
- Data Collection: Gather raw data from sources such as GPS devices, sensors, operational logs, and surveys.
- Data Cleaning: Remove inaccuracies, inconsistencies, and outliers to ensure a reliable foundation for analysis.
- Data Transformation: Convert data into formats suitable for advanced modeling and statistical analysis.
- Data Modeling: Apply sophisticated techniques such as regression analysis and machine learning algorithms to uncover patterns, predict outcomes, and optimize routes.
- Data Interpretation: Translate findings into practical recommendations that empower data-driven decision making and drive real results.
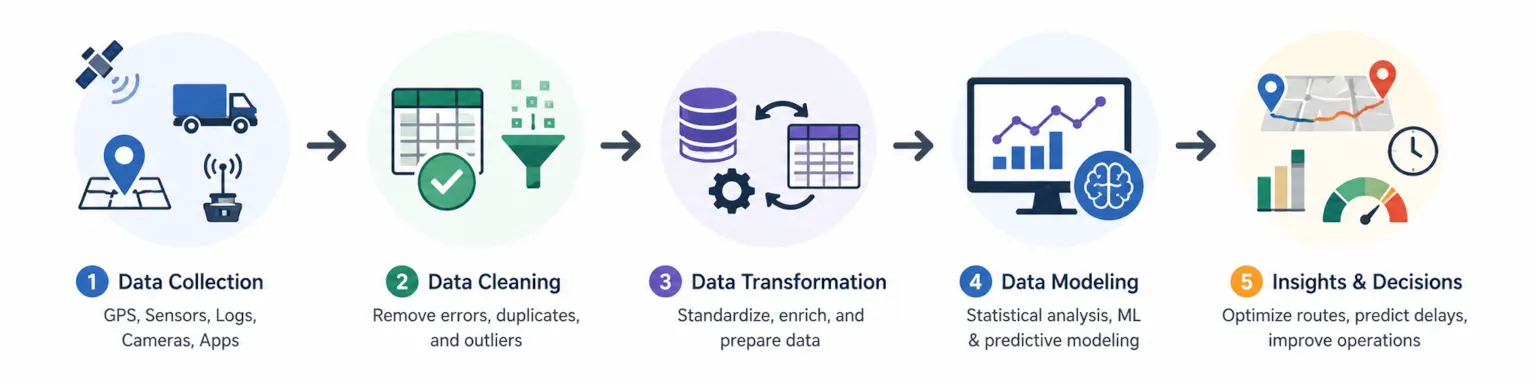
In the transportation industry, this process enables you to optimize routes, predict and prevent delays, reduce fuel consumption, and streamline your supply chains effectively. By leveraging data analytics throughout these iterative phases, you can make informed decisions that enhance operational efficiency and boost customer satisfaction.
With a clear analysis process in place, organizations are prepared to handle the challenges of big data and advanced analytics in transportation.
Data Processing and Big Data
Managing Big Data in Transportation
Big data is a key challenge in transportation data analytics, requiring advanced data processing and analysis techniques to handle large and complex datasets. To extract actionable insights from big data, it is crucial to analyze data using advanced statistical and computational methods.
Data Mining and Statistical Modeling
Data mining and statistical modeling are used to extract insights and patterns from big data, supporting predictive analytics and data-driven decision making. Quantitative data is summarized and analyzed using statistical methods such as descriptive statistics, regression, and hypothesis testing to derive meaningful insights.
Predictive Analysis and Programming Tools
Predictive analysis and predictive modeling are essential for forecasting future trends and patterns, enabling proactive decision making and strategic planning. Statistical programming languages like R and Python are commonly used for modeling, visualization, and data manipulation in transportation analytics—as highlighted in the Python documentation.
Analytics in transportation relies on the integration of data from multiple sources, including traditional methods and new data sources, to provide a comprehensive understanding of the transportation system. The data analysis process often involves iterative phases, with repeated cycles of data cleaning, exploration, and analysis to refine results and uncover deeper insights.
Transitioning from data processing, the next focus is on the professionals who drive these analytics efforts and the value they bring to transportation organizations.
The Role of a Data Scientist
A data scientist plays a key role in transportation data analytics, responsible for collecting, analyzing, and interpreting complex data sets. Data scientists analyze data using various computational and statistical methods to uncover trends and support informed decision-making.
They use a range of techniques, including statistical analysis, machine learning, and data visualization, to extract insights and patterns from data. The ability to visualize data is crucial for communicating insights effectively to stakeholders and supporting clear, actionable reporting.
The data analysis process involves several stages, including data collection, data cleaning, data transformation, and data modeling. Transport analytics integrates multiple data sources to optimize decision-making, improve operational efficiency, and enhance transportation outcomes.
Data scientists work closely with transportation agencies and other stakeholders to identify data requirements and develop actionable insights that inform decision making.
Data-driven decision making is critical in the transportation industry, relying on accurate and reliable data to support strategic planning and policy development. Transportation data analytics utilizes techniques like predictive modeling, machine learning, and real-time analysis to deliver timely and impactful insights.
With skilled data scientists in place, organizations can fully leverage the insights generated from analytics to drive operational improvements and innovation.
Data Insights and Requirements
Driving Competitive Advantage
Data insights drive competitive advantage for transportation companies, helping you make strategic decisions with greater confidence in today's fast-moving industry. These actionable discoveries and trends emerge from analyzing transportation data, enabling you to optimize routes, scheduling, and resource allocation effectively.
High-Quality Data for Real Results
Working with high-quality data that's accurate, comprehensive, and relevant to your specific operational challenges is crucial for generating insights that deliver real results. Our approach involves collecting and processing large volumes of data from multiple sources—GPS data, IoT sensors, and social media feeds—then applying cutting-edge analytics techniques like machine learning and predictive modeling to reveal patterns that traditional analysis misses.
Integrating Data for Better Decisions
By integrating data from various sources, we help you gain a complete view of your operations, enabling data-driven decisions that improve efficiency, reduce costs, and enhance customer experiences. Whether you're aiming to streamline logistics, predict maintenance needs, or improve service delivery, our solutions address real-world transportation challenges.
The ability to extract actionable insights from transportation data empowers you to anticipate demand, optimize resource allocation, and respond proactively to changing market conditions. This drives better business outcomes and supports long-term growth, helping you stay ahead in an increasingly competitive transportation landscape while maximizing the full potential of your operational data.
With actionable insights in hand, organizations can apply analytics to a wide range of real-world transportation scenarios.
Data Analytics in Action
Applications in Maintenance
Data analytics is used in a range of applications, including transportation planning, supply chain management, and logistics. Transport data analytics and transportation data analytics offer valuable insights for optimizing electric vehicle (EV) infrastructure, site selection, and grid planning, enabling organizations to make data-driven decisions for EV charging network deployment and improved travel behavior understanding.
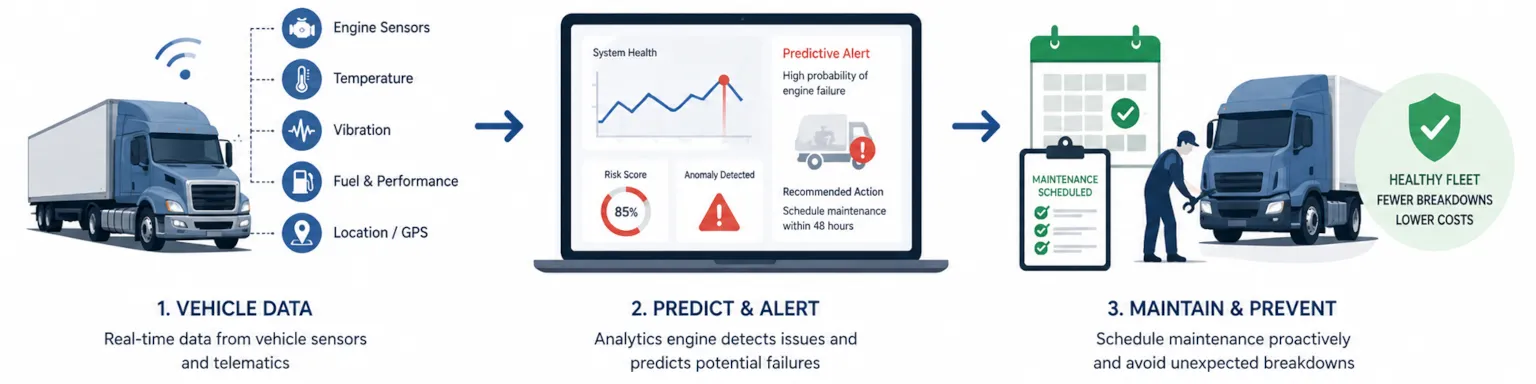
Real-time insights and data-driven decision making are critical for optimizing routes, reducing costs, and improving customer satisfaction. Companies use transportation data analytics to schedule vehicle maintenance, enhancing safety by identifying components most likely to break or underperform and planning maintenance accordingly.
Safety Programs
Safety programs and safety improvement are key outcomes of data analytics in transportation, relying on data-driven insights to inform decision making and policy development. Transport analytics help organizations identify dangerous routes and avoid dangerous routes, which enhances safety protocols and reduces accident risks. Transport analytics also play a crucial role in supply chains by improving visibility, supporting better decision-making, optimizing route planning, reducing costs, and enhancing customer experience through supply chain mapping tools.
Urban Planning
Multiple sources of data are used to provide a comprehensive understanding of the transportation system, including traditional methods and new data sources. Data-driven transportation strategies help organizations optimize route planning, reduce costs, improve safety, and enhance customer experience.
Automatic collision notification systems now transmit crash data to dispatchers for improved emergency response. Predictive maintenance, powered by transportation data analytics, analyzes vehicle performance data to predict failures and schedule timely repairs. IoT sensors on vehicles monitor engine health and predict part failures, enabling proactive maintenance. Connected Vehicle data is an emerging data source, providing richer insights.
Transportation data analytics can provide complete end-to-end trip information, including trip origins, destinations, routes, distances, and travel time, analyzing trips from start to finish across all modes and roads. Dynamic traffic management adjusts signal timings and deploys resources based on congestion data, while smart city traffic management systems use machine learning to reduce congestion. Examining data while in transit can enhance productivity and fuel efficiency. Companies can anticipate daily volumes and optimize delivery routes, improving user satisfaction and customer service processes. Urban planners use travel demand forecasts to prioritize infrastructure projects for sustainable growth. Predictive analytics help foresee events like weather or road closures, leading to significant cost savings and better planning.
In 2026, transportation data analytics has become a mission-critical operational standard for government agencies and logistics firms.
With these applications, organizations can see the tangible benefits of analytics in action, from maintenance to urban planning.
Transportation Systems Optimization
Transportation systems optimization drives efficiency and competitiveness in your operations, and we help you harness advanced data analysis techniques to streamline processes, reduce costs, and deliver superior customer satisfaction. Through systematic analysis of your transportation data, we enable you to optimize routes, schedules, and resource allocation, ensuring every aspect of your operation runs at peak performance.
We use statistical data analysis and exploratory data analysis as essential tools for uncovering trends and patterns within your vast transportation data sets. These data analysis techniques help you identify inefficiencies, anticipate bottlenecks, and make informed decisions that directly impact your business performance. Our predictive analytics services enhance this process by forecasting demand, identifying potential supply chain disruptions, and enabling you to make proactive adjustments to your transportation strategies.
We integrate data science and machine learning into your transportation analytics, unlocking valuable insights that traditional methods often overlook. By applying these advanced technologies, we help you automate complex decision-making processes, optimize supply chain management, and respond swiftly to changing market conditions. The result is a more agile, data-driven organization that consistently delivers on customer expectations and drives measurable improvements in your operational efficiency.
Our transportation systems optimization powered by robust data analysis empowers you to make smarter, more informed decisions, transforming your raw data into actionable strategies that fuel growth, innovation, and long-term success in the transportation industry.
Smart City Traffic Management
Smart city traffic management delivers actionable insights from complex urban data, enabling you to make informed, strategic decisions about transportation infrastructure with greater confidence and precision. By leveraging real-time data from traffic sensors, cameras, and digital platforms, your city can monitor traffic flow, identify congestion hotspots, and implement targeted strategies that address bottlenecks while driving measurable results for urban mobility.
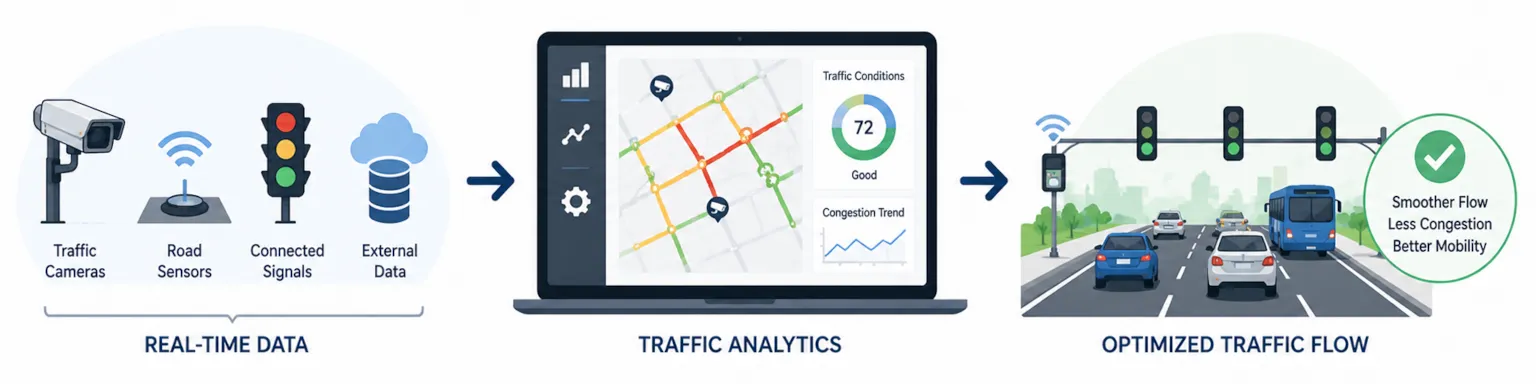
Data analytics enables your city to optimize traffic signal timing, dynamically adjust routes, and deploy resources where they are needed most, helping you reduce congestion and minimize travel times while staying ahead in an increasingly competitive urban landscape. Predictive analytics further enhances these capabilities by forecasting traffic patterns and potential disruptions, allowing your transportation teams to proactively manage traffic flow and improve safety on city streets, whether you are aiming to automate processes, predict peak-hour trends, or enhance citizen experiences.
The integration of real-time data and advanced analytics not only streamlines your urban transportation systems but also contributes to better air quality and more sustainable mobility solutions that align with your city's strategic goals. As cities continue to grow and face mounting transportation challenges, smart city traffic management powered by data analytics will enable you to harness the full potential of these advanced technologies, creating efficient, responsive, and livable urban environments that deliver tangible value to residents while reducing operational costs and improving overall quality of life. For real-world examples of traffic analytics implementations, organizations can see how data transforms urban mobility.
With smart city solutions in place, the focus shifts to supporting the growth of electric vehicle infrastructure through data-driven strategies.
Electric Vehicle Infrastructure Development
Electric vehicles extract tremendous value from strategic data analytics, helping you make informed infrastructure decisions that accelerate adoption and reduce range anxiety with greater confidence.
Transportation agencies combine technical expertise, real-world usage data, and cutting-edge analytics technologies to deliver targeted charging station deployments that address actual driver needs. The process involves understanding peak demand patterns, analyzing existing station performance, and designing intelligent placement strategies that drive results. Whether you are aiming to optimize charging locations, predict usage trends, or improve grid management, data analytics enables you to stay ahead in the rapidly evolving EV landscape.

Data analytics refers to the systematic analysis of transportation and usage information, allowing agencies to identify patterns that typically require complex forecasting, such as demand prediction, location optimization, and grid planning. Advanced analytics involves training algorithms to learn from charging data and make strategic recommendations without requiring constant manual analysis. Transportation agencies specialize in delivering customized data-driven solutions that align with sustainable transportation goals. By analyzing usage patterns, forecasting demand, and deploying intelligent charging networks, agencies harness the full potential of these advanced analytical capabilities. They develop data-driven solutions to strategically place charging infrastructure, improving accessibility and reducing operational costs while supporting grid stability and encouraging broader electric vehicle adoption that saves valuable resources and accelerates the transition to sustainable transportation.
As electric vehicle infrastructure expands, airports also benefit from analytics-driven logistics and scheduling improvements.
Truck Traffic Pattern Analysis
Truck traffic pattern analysis delivers actionable insights from complex transportation data, helping you make informed, strategic decisions about your routes with greater confidence. By leveraging data analysis techniques on your truck-specific transportation data—such as GPS feeds and traffic sensor information—you can gain the granular understanding of traffic flows your organization needs, identify those troublesome high-congestion zones, and implement strategies that minimize delays and fuel consumption across your network.
Ensuring your data quality remains paramount in this process, as accurate and reliable data forms the foundation that enables you to conduct effective analysis and make informed decisions that drive real results. Statistical programming and data visualization tools allow you to process and visualize large volumes of your truck traffic data, revealing key metrics and actionable trends that deliver the operational improvements your business demands.
Advanced data analysis techniques, including regression analysis and predictive modeling, enable you to forecast traffic patterns, anticipate potential disruptions before they impact your operations, and optimize your routes in real time. By continuously monitoring and analyzing your truck traffic data, you can make data-driven decisions that improve your efficiency, reduce your operational costs, and support safer, more reliable transportation networks that keep you competitive.
With a focus on optimizing your routes and reducing fuel consumption, truck traffic pattern analysis delivers valuable insights that help you stay ahead of industry challenges, enhance your business performance, and provide better service to your customers in an increasingly competitive transportation landscape.
Airport Logistics and Scheduling
Efficient airport logistics and scheduling form the backbone of your operations, directly impacting passenger satisfaction and your bottom line. Data analytics empowers you to optimize every critical aspect of your airport operations, from flight scheduling and baggage handling to ground transportation coordination. By analyzing transportation data from your flight schedules, passenger flows, and baggage systems, you can pinpoint operational inefficiencies and implement targeted improvements that deliver measurable results.
Predictive analytics serves as your strategic advantage in forecasting passenger demand, enabling you to adjust staffing levels and resource allocation dynamically. This proactive approach allows you to minimize costly delays, reduce congestion, and ensure your ground transportation systems operate with seamless precision. Data analytics also supports your airport logistics optimization efforts, helping you streamline critical processes, lower operational costs, and enhance overall efficiency across your entire operation.
By leveraging predictive analytics and comprehensive transportation data, you can deliver superior passenger experiences, dramatically improve your operational performance, and maintain a competitive edge in the fast-paced aviation industry. These advanced analytical capabilities enable you to stay ahead of operational challenges while maximizing both efficiency and profitability.
With airport operations optimized, organizations must also address common barriers to effective data analysis.
Railroad Operations Optimization
Railroad operations optimization drives efficiency and competitiveness in the transportation industry, and data analysis delivers the transformational power behind this revolution. Railroad companies harness advanced analytics to streamline operations, slash costs, and deliver superior customer satisfaction in today's complex, demanding market environment.
Advanced data analysis techniques optimize scheduling, manage train movements, and allocate resources with precision.Organizations extract real-time insights from transportation data across multiple sources—GPS data, track sensors, operational logs—gaining immediate visibility into train locations, track conditions, network congestion. This enables data-driven decision making that eliminates delays, maximizes asset utilization, ensures efficient routes across rail networks.
Cost reduction delivers significant impact through strategic data analytics implementation in railroad operations. Predictive analytics and statistical analysis identify patterns in fuel consumption, maintenance requirements, crew scheduling, empowering companies to address issues before they escalate into costly disruptions. Railroad companies leverage predictive modeling and machine learning to schedule vehicle maintenance accurately, avoid dangerous routes, optimize supply chain management, driving lower operational expenses and improved business performance.
Customer satisfaction sits at the core of successful railroad operations, and data analytics drives enhanced service reliability and on-time performance. Continuous monitoring of key metrics and analysis of recent data enables railroads to anticipate bottlenecks, adjust schedules in real time, communicate effectively with customers. This data-driven approach improves passenger experiences while strengthening relationships with freight clients through timely, dependable deliveries.
Real-world railroad data analytics applications include predictive maintenance programs utilizing machine learning to forecast equipment failures, safety improvement initiatives analyzing accident data to avoid dangerous routes, supply chain optimization strategies integrating data from multiple sources for end-to-end visibility. These initiatives empower railroads to make informed decisions, respond swiftly to changing conditions, maintain competitive advantage in the transportation industry.
Railroad companies embed data analytics into every operational aspect, unlocking valuable insights from transportation data, driving continuous improvement, setting new standards for efficiency, safety, customer satisfaction.
Overcoming Analysis Barriers
In the transportation industry, overcoming analysis barriers is essential for unlocking the full potential of your data and driving operational efficiency that keeps you ahead in an increasingly competitive landscape. One of the most significant challenges you face is ensuring high data quality, as inaccurate or incomplete information can lead to misguided decisions and costly inefficiencies.
Your transportation organization can address this by implementing cutting-edge data collection protocols and applying advanced analysis techniques such as data validation, normalization, and transformation. These tailored solutions help you clean and standardize raw data, making it suitable for deeper analysis that delivers actionable insights. Organizations focused on effective data management can overcome these barriers more efficiently.
Machine learning also plays a pivotal role in helping you overcome analysis barriers by uncovering hidden patterns and trends within your complex transportation data sets. By leveraging these advanced technologies, your organization can optimize routes, enhance supply chain management, and make more informed, strategic decisions based on reliable data that drives real results.
Whether you're aiming to automate processes, predict trends, or improve operational experiences, prioritizing data quality and adopting modern analysis techniques enables you to break down barriers to effective analysis, leading to smarter decision making and improved business performance that addresses the real-world challenges facing the transportation industry.
Once barriers are addressed, organizations can maximize the value of analytics by leveraging powerful, cost-effective tools.
Free Software for Analysis
Transportation agencies can harness cutting-edge data analysis capabilities through powerful free software solutions that deliver real-world results. Below is a comparison of popular free tools for transportation data analytics:
| Tool | Key Features | Best For |
|---|---|---|
| R | Extensive libraries for statistical analysis, data visualization, and modeling | Statistical analysis, modeling |
| Python | Versatile, with libraries for machine learning, data manipulation, and visualization (e.g., pandas, scikit-learn, matplotlib) | Machine learning, automation |
| Julia | High-performance computing, easy syntax, growing ecosystem | Large-scale data processing |
| Tableau Public | Intuitive interface for creating interactive dashboards and visualizations | Data visualization |
| Microsoft Power BI | User-friendly dashboards, integrates with various data sources | Business intelligence, reporting |
These advanced tools support everything from regression analysis to sophisticated predictive modeling, empowering organizations to extract meaningful intelligence from complex data sets that drive strategic decision-making. For organizations seeking custom dashboard solutions, professional development services can extend these capabilities further.
By leveraging these free software solutions, transportation agencies can perform advanced analytics, analyze large and complex data sets, and make informed decisions that boost efficiency and drive innovation within the competitive transportation industry.
Ensuring the reliability and transparency of analysis is the next step in building trust and driving continuous improvement.
Reproducible Analysis
Ensuring reproducible analysis drives reliable data-driven decision making that keeps your transportation operations ahead in today's competitive landscape. Reproducibility means your data analysis process can be independently verified and repeated, which builds trust in your transportation insights and enables you to harness the full potential of continuous improvement.
To achieve this, you should meticulously document your data sources, processing steps, and analytical methods throughout your analysis workflow.
Cutting-edge data science tools such as Jupyter Notebooks and R Markdown deliver transparent documentation by allowing your analysts to combine code, results, and narrative explanations in a single, shareable format that drives results. Version control systems like Git further enhance your reproducibility by tracking changes to code and data over time, helping you make informed decisions with greater confidence—as recommended by the U.S. Department of Transportation for federal transportation data initiatives.
By adopting these best practices, you ensure your analyses are transparent, reliable, and easily audited. This approach not only supports your strategic efficiency and safety improvements but also drives higher customer satisfaction by enabling you to stay ahead through data-driven enhancements in transportation planning and service delivery.
Summary: The Mission-Critical Role of Transportation Data Analytics
Transportation data analytics has become a mission-critical operational standard for government agencies and logistics firms, fundamentally transforming the industry. By leveraging diverse data sources—including GPS data, sensor data, and emerging Connected Vehicle data—organizations gain comprehensive, real-time insights that drive smarter decision-making and operational excellence. For organizations looking to transform cloud data into business decisions, transportation analytics provides a clear pathway to actionable intelligence.
Key benefits of transportation data analytics include:
- Enhanced Decision-Making: Advanced analytics, predictive modeling, and machine learning empower organizations to make informed choices in logistics, route planning, and resource allocation.
- Cost Reduction: Real-time traffic analysis and predictive analytics optimize routes, reduce fuel use, and anticipate daily volumes, leading to significant cost savings.
- Improved Safety and Compliance: Data-driven insights into traffic patterns and vehicle performance support safety programs, compliance, and proactive maintenance, reducing accident risks and improving emergency response.
- Comprehensive Data Integration: Utilizing a wide range of data sources enables end-to-end trip analysis, from trip origins and destinations to routes, distances, and travel times, across all modes and roads.
- Real-Time Optimization: Real-time data analysis allows for dynamic adjustments in traffic management, airport logistics, and EV infrastructure, ensuring efficient operations and superior customer service.
- Customer Service Excellence: Analytics-driven strategies help organizations anticipate demand, streamline delivery routes, and enhance customer satisfaction through improved service processes.
By embracing transportation data analytics, organizations not only achieve operational efficiency and cost savings but also foster innovation, safety, and customer-centricity. As the industry continues to evolve, transportation data analytics will remain a cornerstone of success, enabling continuous improvement and sustainable growth in a data-driven world.
FAQs Related To Traffic Analytics
What is Travel Analytics?
Travel Analytics is the process of collecting, organizing, and analyzing travel-related data to understand demand patterns, traveler behavior, revenue performance, and operational efficiency across channels such as direct bookings, OTAs, and partner distribution.
What business problems does Travel Analytics solve?
Travel Analytics helps solve problems such as uncertain demand forecasting, inconsistent performance across markets, unclear channel profitability, fragmented customer data, and limited visibility into booking funnels, cancellations, and repeat travel behavior.
What data sources are typically used in Travel Analytics?
Travel Analytics commonly uses data from booking engines, OTA feeds, CRM and loyalty systems, web analytics, pricing and revenue management tools, call center systems, email and campaign platforms, customer reviews, and operational systems such as property management or tour management platforms.
What are the most important KPIs in Travel Analytics?
Common Travel Analytics KPIs include conversion rate, booking volume, average booking value, revenue per visitor, customer acquisition cost, channel mix, cancellation rate, lead time, length of stay, repeat booking rate, and lifetime value.
How does Travel Analytics improve revenue and profitability?
Travel Analytics improves revenue by identifying high-performing channels and markets, uncovering pricing and packaging opportunities, reducing discount leakage, improving campaign targeting, and measuring true profitability after fees, commissions, and operational costs.
How does Travel Analytics support demand forecasting?
Travel Analytics supports demand forecasting by analyzing historical booking trends, seasonality, market signals, lead time patterns, and event-driven spikes to predict future demand and guide capacity, pricing, and marketing decisions.
Can Travel Analytics help optimize marketing performance?
Yes. Travel Analytics helps optimize marketing performance by linking spend to bookings, measuring attribution across channels, identifying high-intent audiences, improving landing page and funnel performance, and tracking conversion drivers by segment and geography.
How does Travel Analytics improve customer experience and retention?
Travel Analytics improves customer experience by revealing friction points in the booking journey, identifying service issues that drive refunds or poor reviews, and enabling personalized offers and messaging that increase satisfaction and repeat bookings.
How do teams handle multi-region and multi-brand Travel Analytics?
Multi-region and multi-brand Travel Analytics standardizes KPI definitions, normalizes data across markets and currencies, consolidates channel reporting, and enables accurate comparisons across regions, brands, and properties while preserving local performance context.
What is the difference between Travel Analytics reporting and Travel Analytics strategy?
Travel Analytics reporting summarizes what happened, while Travel Analytics strategy explains why it happened and what actions to take next by connecting data across sources, standardizing metrics, and surfacing the levers that influence bookings and revenue.
What are common challenges when implementing Travel Analytics?
Common Travel Analytics challenges include disconnected systems, inconsistent tracking across channels, duplicate customer records, incomplete attribution, mismatched definitions of revenue and bookings, and delayed data refresh that prevents timely decisions.
What is a typical process for implementing Travel Analytics?
A typical Travel Analytics implementation includes defining goals and KPI definitions, mapping data sources, consolidating and cleaning data, building dashboards and analytical models, validating results against finance and booking totals, and iterating based on stakeholder needs.